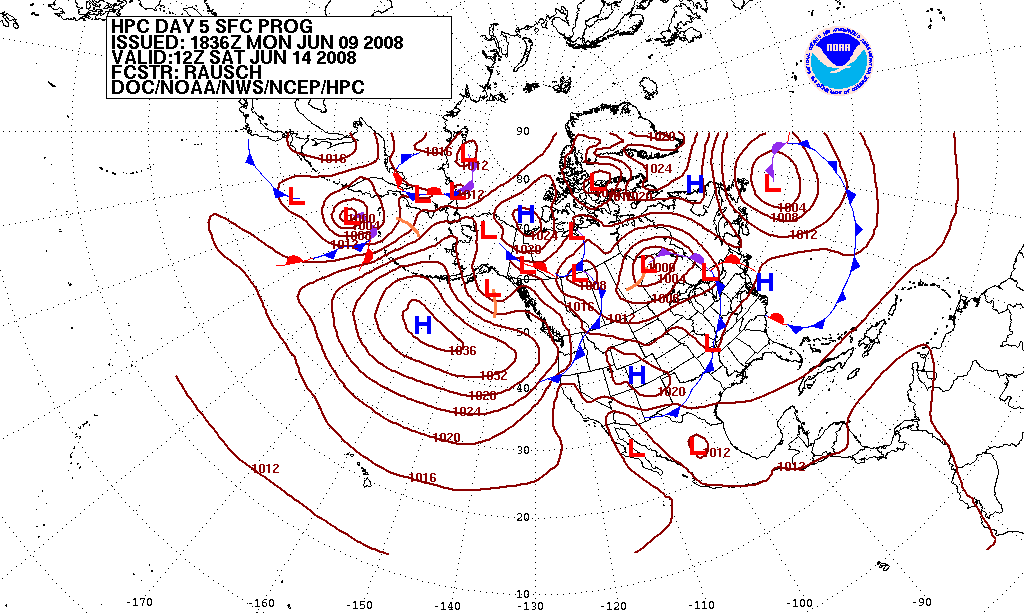
NOAA's seasonal outlooks, including the 2026-27 winter forecast built around a near-record-strength El Niño, do not predict individual storms. Instead, the Climate Prediction Center assigns probabilities to three-month temperature and precipitation categories by combining ocean-temperature data, computer models and forecaster judgment.
A Near-Record El Niño Is Driving This Winter's Outlook
According to NOAA's Climate Prediction Center (CPC) ENSO Diagnostic Discussion issued September 10, 2026, sea-surface temperature anomalies in the eastern equatorial Pacific had already exceeded +3.0°C. On that basis, CPC placed the probability of a 'very strong' El Niño persisting through Northern Hemisphere fall and winter 2026-27 at greater than 90%, with a 75% chance it becomes the strongest event on record since 1950 — a threshold defined as a three-month RONI (Relative Oceanic Niño Index) value of +2.5°C or higher.
El Niño strengthened further over the past month, with sea surface temperature anomalies exceeding +3.0°C in the eastern equatorial Pacific.
That single ocean measurement is the starting point for the seasonal outlooks now shaping winter headlines across the country, including forecasts for New York State published in early September 2026 by New York Almanack.
What a Seasonal Outlook Actually Shows
Climate.gov's explainer on NOAA's monthly and seasonal outlooks describes the maps as probability estimates, not day-by-day forecasts. For a given region, forecasters assign a percent chance that the upcoming month's or season's average temperature or precipitation will fall in the top third, middle third, or bottom third of the 1991-2020 historical record. Forecasters never set the probability of a less-favored category below 3.3%, and areas shown in white on CPC maps mean the three outcomes are judged equally likely — an 'equal chances' call, often used when competing climate signals cancel each other out.
A map that favors 'above normal' temperatures for a season therefore describes a statistical tilt over three months, not a guarantee against cold spells. New York Almanack's September 2026 outlook noted that shorter-term atmospheric patterns such as the Arctic Oscillation and North Atlantic Oscillation can temporarily override El Niño's influence, which is one reason a milder-leaning seasonal outlook can still include individual cold snaps or snowstorms.
Models Feed the Forecast, People Finish It
Behind the probability maps sits NOAA's Climate Forecast System version 2 (CFSv2), described on CPC's own technical page as a model run four times per day using initial conditions from the previous 30 days, producing ensembles of 40 forecast members grouped into three 10-day batches. Its output is expressed as anomalies measured against a 1991-2020 hindcast climatology.
CPC's documentation is explicit that CFSv2 output is not itself the official forecast: 'model based seasonal climate anomalies are one factor based on which [the] seasonal forecast outlook is issued.' In practice, human forecasters weigh the model guidance against the current ENSO state, long-term trends and historical analog seasons before finalizing the probability maps that NOAA publishes.
New York's Winter 2026-27 as a Case Study
Applying that process to New York, the state's outlook reported by New York Almanack on September 4, 2026 pointed to milder overall temperatures with fewer prolonged Arctic cold snaps, and reduced total seasonal snowfall as typical winter storm tracks are more likely to deliver rain, sleet or freezing rain instead of snow. The outlook described December as likely wetter, January and February as carrying some chances for snow, and left open the possibility of late-February-into-March snow accumulation.
How This El Niño Compares
The scale of the current event is part of why forecasters are treating it as a major driver of the winter outlook. CPC's advisory and New York Almanack's reporting, both citing NOAA data, put the following figures on record:
El Niño strength: this winter versus the previous record
Event
Peak Niño 3.4 sea-surface anomaly
Source
2015-16 El Niño (previous record event)
+2.6°C
New York Almanack, citing NOAA data (Sept. 4, 2026)
Even a strong ENSO signal does not eliminate forecast uncertainty. CPC's own category system — above normal, below normal, or equal chances — is built to communicate that uncertainty rather than hide it, and climate.gov notes the probability floor of 3.3% exists precisely because no outcome is ever treated as impossible. New York Almanack's reporting likewise flagged that shorter-lived atmospheric patterns can temporarily push conditions against the seasonal lean.
A seasonal outlook gives probabilities for 3-month temperature and precipitation categories — it is not a prediction of specific storms or cold snaps.
The state of El Niño or La Niña in the tropical Pacific is the single largest input into winter outlooks for the United States.
Numerical models such as CFSv2 generate ensemble forecasts that human forecasters then interpret alongside historical and trend data.
A 'warmer' or 'wetter' seasonal outlook describes where the odds are tilted over the whole season, not what will happen on any given day.
Questions
How far in advance can meteorologists issue a seasonal forecast?
NOAA's Climate Prediction Center produces outlooks for periods from two weeks to roughly a year ahead, using tools such as the CFSv2 model, according to CPC's own technical documentation.
What does 'equal chances' mean on a NOAA winter outlook map?
It means forecasters judge all three outcomes — above normal, near normal, and below normal — equally likely for that area, typically because no climate signal is strong enough to tilt the odds, as explained by climate.gov.
Does El Niño guarantee a snow-free winter in places like New York?
No. New York Almanack's September 2026 reporting on the outlook noted that while El Niño favors milder, less snowy conditions overall, atmospheric patterns like the Arctic Oscillation can still bring cold snaps or snow events within the season.
How strong is the El Niño behind the 2026-27 winter outlook?
NOAA's Climate Prediction Center reported sea-surface anomalies above +3.0°C in the eastern tropical Pacific as of September 10, 2026, with a greater than 90% chance of a 'very strong' event through winter and a 75% chance it becomes the strongest on record since 1950.
What models does NOAA use to build these outlooks?
CPC's seasonal guidance includes output from its Climate Forecast System version 2 (CFSv2), an ensemble model run four times daily, though CPC states this model output is only one factor forecasters weigh before issuing the official outlook.
This piece was prepared with artificial intelligence and passed an automated source check before publication. If you see an error, ask for a correction. Request a correction or reply · How we make this
South India's main rainy season, the Northeast Monsoon, is expected to reach Tamil Nadu between October 15 and 21, 2026, according to India Meteorological Department (IMD) director general Mrutyunjay Mohapatra. Estimates of how much of the state's annual rainfall it supplies vary by source — around 48% for Tamil Nadu overall (Ekam IAS Academy) or about 50% for southern districts specifically (Mongabay India) — spread over roughly 50 days. This year's season is forecast to be normal overall, with wetter coasts and a drier northern interior.
Growing your own vegetables and herbs starts with six basic steps the USDA outlines: planning, choosing a site, preparing soil, planting, maintenance and harvest. Compost, efficient watering and mixed plantings are the practices most recommended by agricultural and horticultural authorities, though a 2024 study found a garden's own climate benefit depends on how it is built and maintained.
Modern weather forecasts are produced by feeding billions of daily observations into supercomputers that solve physics equations on a global grid, a process called numerical weather prediction. Forecasters then run the model many times with slightly varied starting conditions — an "ensemble" — to gauge how confident a prediction is. Because the atmosphere is chaotic, forecasts lose reliability after roughly 9 to 15 days, according to researchers and national weather agencies.
Brazil's Amazonas state recorded 1,380 forest fire hotspots between October 1 and 10, 2026, a 271% rise from the 372 hotspots counted in the same period of 2025. Governor Roberto Cidade declared a state emergency, and the federal government recognized emergency status in 36 municipalities on October 10, releasing aircraft, firefighters and funds to fight the blazes.